Archives
- May 2011 (2)
The new sign of SUCCESS
This is my first technical blog and would like to discuss my experience in profiling JBoss Application Server (EAP/EPP) using JProfiler.
The following servers/tools are required.
The following servers/tools have been profiled using JProfiler while preparing writing this blog.
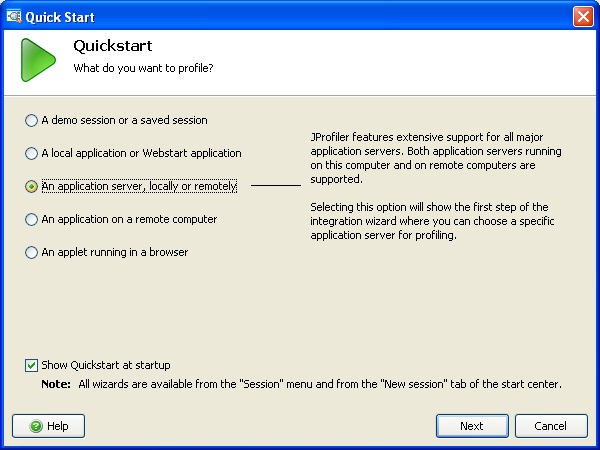
Step 1. Once JProfiler is download start the JProfiler using its exe or from start menu. You may see something as below
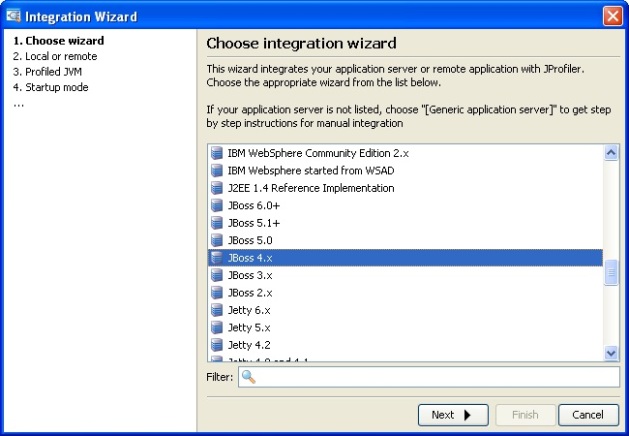
Step 2. Select the Server to profile. I am using JBoss EPP 4.3 so I am selecting JBoss 4.x server from list.
Step 3. In the next screen you have to specify where this JBoss server resides. If you are trying to profile remote server, you may have to have JProfiler agent running on remote server. In my case, I have my JBoss server in local machine

Step 4. In next wizard you have to specify JVM vendor you have been using in your machine. Please select appropriate JVM vendor, version and Mode. Also please check the box if you are using 64bit JVM! Here are my settings

Step 5. In the next wizard you have to specify whether your application server (JBoss) would like to wait for a connection from JProfiler GUI! I am specifying “wait for a connection from the Profiler GUI” because it is easy to configure and flexible. Here is where I am now.

Step 6. In the next step, you have to specify the batch/script file used to start your application Server. Specify the run.bat location by browsing.

Step 7. In the next wizard, you have to specify the port to be for profiling connection. JProfiler by default uses 8849, check if you have this free (by using DOS command “netstat –aon”) otherwise you may have to change this port. In my case no other application using this port so I am going with the default.

Step 8. We are almost there. Check the required modifications we have done so far then click on Next.

Step 9. By this step, we have done enough configurations and our integration is finished. By this step your application is ready to be profiled and will be automatically started.

Step 10. In the next step, you may have to specify Initial profiling settings whether Instrumentation/Sampling. Instrumentation covers all features to be tune, so I am going with this. Check appropriate settings for your need

Step 11. Once you click Ok in Session Start-up window, you may notice that your JBoss server has already been started. You may see something like

Step 12. Check whether your JProfiler is started JBoss server as well? Check Trouble shooting section if your server is not started with JProfiler. In my case JProfiler started my server.


This screen specifies the number of instances have been created for each class. You may also see the size of those instances occupying in memory.


In the above screen I clearly see number of instances have been created and their size for my class/package.
To do CPU profiling click on “CPU View” left pane. You may see something like


Trouble Shooting
That’s all about profiling experience I had. Please feel free to play around in JProfiler GUI. Happy Profiling!!!
Last but not least, I would really appreciate if you share your valuable comments and caught me if I was wrong anywhere.
Cheers,
Shashi
Hi there,
Well, I am Shashi. After all a long investigation on writing and starting my blogs, here is where I am!
I have been thinking since for while on starting writing blogs. I have gone through plenty for forums and discussions. I even gone through plenty of sites where in I can have free/very less-expensive to have my own virtual place in this world. Finally I see myself with wordpress comfortable. I think wordpress made easy of expressing yourself in the blog, it’s very easy to use and in couple of seconds you will get what you are looking for!
Well, I have been IT industry since 6 years from now. My expertise is developing enterprise applications using Java/J2EE. I have plenty of personal knowledgebase documents in my desk and now I am interested to share this with my friends here. Please note that I am not expert and would not make any final statements while writing technical blogs, there could be plenty of ways to solve problem. I will share what I know, you have any other options/suggestions? Please share, I would love to have a look.
Ok! That’s all about now. Take care guys!!!
Cheers,
Shashi
